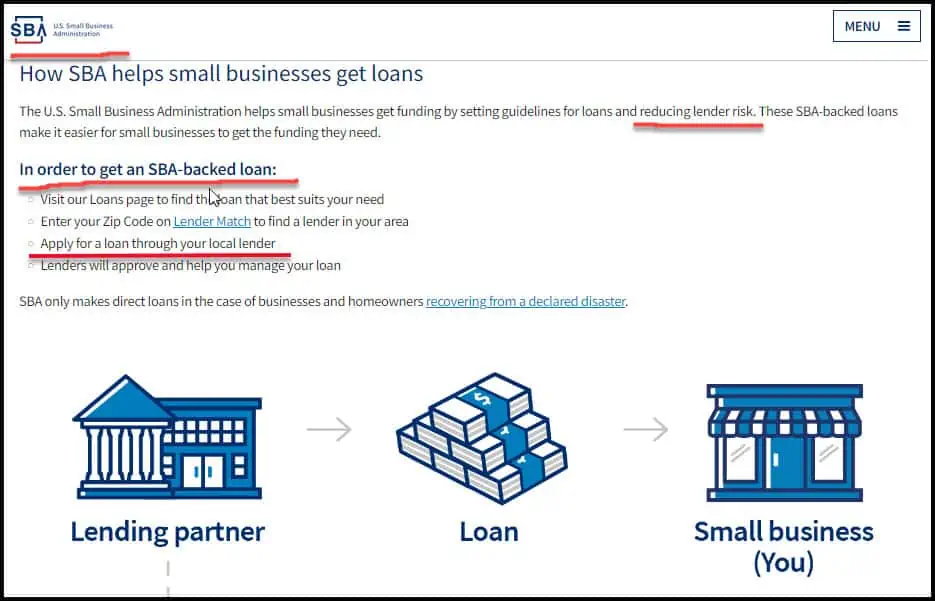
What type of loan is best for starting a business with no money?
Do you need a loan to start a business? Looking at the best type of loan options for your start-up? […]
Read More »Become a successful marketing consultant: Learn more

“…for every 100 leads, Karl is going to make 12 sales.
He has an 12% lead to sales ratio.”
Your lead to sales conversion rate is a very simple equation and is the heart of any business: The number of sales divided by the number of leads equals the 'lead to sales' ratio. If you make 112 sales for every 1,000 leads then you have a 11.2% lead to sales ratio (112/1000 = 11.2%).
Every company has a ‘lead to sales’ ratio --whether they measure it or not.
Whether they use a sales staff of 30+ like Karl’s Medical Supplies or just a website.
Your lead to sales ratio will be your roadmap for realizing growth, telling you:
Your lead to sales ratio is the pulse of your business. It is the heart. Everything around it is secondary.
But, most companies fail here in two ways:
1) By not measuring the effectiveness of each advertising source as Karl discovered, and
2) Leaving a huge share of the business on the table, largely due to:
We did a deep dive into the How Marketing Supports the Sales Department and we provided a free template for you to use, now we are going to look at how the sales team manages the leads that come in through the front door.
This is a common question, and there is really only one answer: it depends.
The percentage of leads that turns into sales depends upon many factors including advertising campaigns, industry, price points, customer expectations, salesperson follow up, benefit to the customer, and more. While the Key Performance Indicators (KPIs) for each company within each industry could vary greatly, a good conversion rate could be 10.0%. That is, for every 100 leads, 10 people buy.
Let’s now look at the metrics for one of our clients at Karl’s Medical supplies (name, industry and KPIs have been changed for privacy). Karl sells products and services via a sales staff of 30 from his very popular website.
Karl knows with a very high degree of certainty that for every 1000 leads his company brings in the front door that he is going to make 120 sales.
His company has a 12% lead to sales ratio.
We also figured out that for every sale he makes, 50% of his customers will buy at least one additional product, thus adding to the lifetime value of his customer. But this is a topic for another tutorial.
Onward.
But a 12% lead to conversion rate is only telling part of the story. Since he has 30 sales people, this is his average closing rate.
One of Karl’s top producers, Tara, has an 18% lead to sales ratio. That is, for every 1,000 leads she receives, Tara closes 180 sales.
But, not all of Bill's sales staff closes 18% of the leads that come into Karl’s business. Since Karl now records the closing ratio for every member of his sales staff, he takes the average of all his sales staff to come out with a 12% ratio.
For your free sales conversion rate tracker, just click on the image or the headline. It's in a Google Sheets document, so you can save it and download and manage it as your own.
Now that we know Karl’s important ratios, we can work on increasing the number of sales his company makes.
After all, what if Karl can increase his average from 12% to 14%?
A 2% increase doesn't sound like much, does it?
In reality. an increase of 2% is huge, when you consider the value of each sale and the lifetime value of each customer.
For example, if each transaction is $10,000, a 2% increase is another 100 sales in this example, representing another $1,000,000 in sales revenue simply for improving the sales efficiency.
That is absolutely astounding! And focusing on getting better at the process should be everyone's top priority.
Here’s how we do that.
Now that we have a tight focus on Karl’s most important number, his Lead to Sales Ratio, and how each of his team members are doing, we can focus on improving.
At first glance, Karl can invest resources into helping his lower producers increase their numbers. The first place to start is to have his better closers do sales training in team meetings and do some ongoing online sales training.
Another tool is to build a simple dashboard of powerful metrics so the team members can track their most important sales metrics.
This is valuable because it allows each team-member to live out careful metrics, identify their strong points, their weak points, and provide better training to lift up all the ratios.
Here’s an example of a scorecard our team developed for Karl.
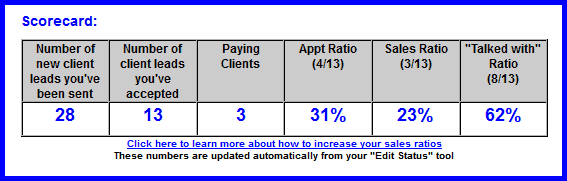
The scorecard in this example is composed of six categories, and they are really designed to help you define your numbers. They are:
This is the number of New Client Lead opportunities that you have been delivered and is often updated automatically based on the software. In this case we built an SQL database system, so most data points are automatically updated.
Just what it says, this is the number of client leads you have accepted and is also updated automatically.
This important number is your number of paying clients in relation to the number of New Leads you have accepted.
Will 100% of New Leads become a paying client? Of course not. Probably not in any industry, but knowing your number gives you a starting point and a baseline to improve.
This is the ratio of your appointments set with accepted New Leads. You might want to focus a lot of your energy here as the first appointment is where you and your potential customer find out if there is a fit.
This is the ultimate ratio that many sales people use to measure their overall skills.
This is the building block of all your success. The more people you enter into a conversation with, the more customers you should gain.
Ok, lastly, here’s one example of why these statistics can be so important to the sales process ...
Let’s say that your “Talked With” ratio is 70%, that is, you entered into a phone conversation with 7 out of 10 of your leads. Now let’s say that your Appointment ratio is 0%, that is, you have not set any appointments to meet with your new lead.
Without setting an appointment, chances are doubtful that you will gain a customer. Now, when you see the objective data as reported by your scorecard, you can put your energy into improving your ratios.
This is because…
If you need assistance along the way, Your Strategic Marketing Partner is happy to help!