How to Structure Your Marketing Department (the plan)
Regardless of the industry that your business competes in, marketing plays a crucial role in attracting and retaining customers. In […]
Read More »Become a successful marketing consultant: Learn more

"What is measured can be improved and what is not measured cannot be improved." -- Your Strategic Marketing Partner
Below is a valuable tutorial and a free template for your use to help you build your own marketing campaign teacher, to track cost per lead (CPL) and cost per sale (CPS).
Recently, one of my most favored client’s asked me to help his sales staff increase sales.
I said, “Yes! We can absolutely do that! Here’s what we need to do first:
Let’s define your key performance indicators (KPIs) so we can see what is working, what is not working and where the biggest opportunities are to increase sales quickly.”
Marketing supports the sales department in many ways, four initial and very important methods are:
The company, Karl’s Medical Supplies (name has been changed for privacy), has been a leader in their industry for 20 years and has a substantial database of customers.
Karl’s business is not unlike any other business on the planet.
He advertises his business, develops leads, and makes his products and services available to his leads via a sales staff of 30 and a website.
So, when Karl asked me to help him increase sales, the first thing I did was to quantify what he was currently doing – in other words, we checked his Key Performance Indicators (KPIs).
Here’s exactly what we did.
You see, without looking at Karl’s existing marketing metrics, we would be shooting blind, similar to throwing darts at a dartboard while wearing a blindfold.
Standard marketing metrics (a.k.a, key performance indicators) are focused on measuring customer interactions and marketing spend, such as:
Surprisingly enough, many companies operate their business without actually knowing:
First, we walked over to the accounting department to get the ‘marketing spend report’ to determine where the budget was going.
By establishing the Key Performance Indicators (KPIs) for marketing, you can now bring financial accountability to each lead source, know exactly how much each sale is costing us from each source, and increase (or decrease) the marketing budget accordingly.
By looking at where Karl was advertising, carefully monitoring the number of lead sources he had working for his business, and tracking how many leads he received from each source, I was able to establish the first of the important ratios we needed:
The first stat we needed were his lead ratios. That is, how many potential buyers are being added to the database as a result of advertising.
Karl was already advertising and he didn't know what he was getting from each ad source. So we first grouped his marketing and advertising into general campaign categories.
In the beginning we wanted to keep it simple and highly track-able based on his main business drivers (many sources of business are not attributed to just one source). These gave me enough information to build an infrastructure to the marketing department by developing these line items:
This is literally the beginning of a tracking, measurement, calendar and budgeting process that can drive your marketing systems.
Karl was advertising in multiple print locations, magazines and journals. He also had many online ads using pay per click sources and online newsletter advertising sources.
So the line items on his tracking tool looked like this:
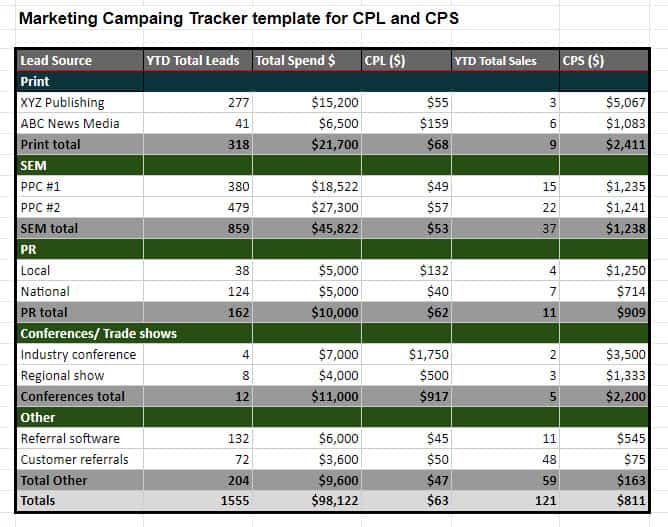 Just click on the image to go to the Google Sheets doc. You will need to save it as your own if you want to manage the document.
We then broke this report into a marketing calendar format and showed exactly how much each category and each ad cost per month and per year. This formed our budget and showed exactly how much we were spending.
Now we can get busy populating the leads and sales and putting each source to work against one another.
Businesses need leads and more importantly they need sales. And you can’t get a sale without bringing someone through the door in one way or another. Once they get into your doors or your website, the sales process happens, which leads us to identify and measure the sales ratios -- which we will get to in the next section.
But in order to get a lead, you must show your advertisement to people by getting your ad in front of them; some will ‘raise their hand’ and respond to your offer and become a lead.
Your goal is always to make your ads compelling so more people will respond to your ad -- after all, since you are spending the money it is your fiscal duty to get the highest response possible.
Now that we have the lead sources identified and working against each other based on numbers in, our next step is to find out which source actually is the best performing financially.
Unless we carefully studied the advertising sources, we would have no idea what was the most productive ad source, what was the least productive, and what was worthy of significant ongoing advertising dollars.
Before we dig into the financials of each advertising source, we need to ensure each and every single potential source of business is handled properly.
This is why your "house list" needs to be super solid and reliable. Without it, your business house will crumble!
After all, the last thing you want is potential new business falling through the cracks, creating advertising waste -- which happens more than you think!
After 12 months of Karl and I working closely to increase the number of leads his business acquires on a daily, weekly, and monthly basis, his business did in fact grow like clockwork.
His sales staff had more qualified leads to call on. His website made more sales because there were more people in his “house list” and we were effectively communicating with his list.
New, more benefit-focused and automated follow up systems also increased sales.
We increased his numbers by nearly 50% compared to the year prior.
That is, 50,000 people in year one became part of his “house list” and we increased his numbers to 75,000 in year two. Simultaneously we improved his sales procedures to increase his house "batting average", a.k.a. The closing ratio, also called the 'lead to sales' ratio.
In turn, his sales grew.
In this case, his leads increased by 50%, so if current metrics stayed the same, sales would also go up by 50%. And in the ideal world, where:
If all these factors are working together on a growing scale, just as they were working on a small scale, then sales should grow at a proportional rate according to the same metrics.
And in Karl’s case, they are increasing.
But, in order to avoid wasting valuable leads and to properly address the concerns of customers and future customers, it is very important to maximize every step of the sales process.
Here’s what happened next…
Karl and I increased leads by creating many new online, print and direct mail lead generation programs. And this got very exciting! Each program brought in new leads and sales.
But guess what?
As we were creating these programs Karl did not have an efficient program to handle the influx of new leads.
After all, before me, he was only crudely tracking the number of financial transactions in an excel file.
I got a phone call from one of the very talented sales team members who said, “Sam, our sales team is backed up with leads that we haven't called from weeks ago -- because we know new leads come in like clockwork each morning!”
This meant that Karl was spending millions of dollars to bring in new leads to give to the sales staff, who weren't actually getting followed up with!
And this brings me to my second and more important way of increasing sales which we will investigate in our next tutorial.
For the free sales and marketing campaign tracker for cost per lead and cost per sale, go here.