
Marketing for Sales: Lead to sales conversion rate template
How is lead sales ratio calculated? “…for every 100 leads, Karl is going to make 12 sales. He has an […]
Read More »Become a successful marketing consultant: Learn more

Now that we know precisely how much each source of business is actually costing you, it's time to put every source to work against each other (we can even do this per salesperson, telemarketer, etc). This is where you'll discover such things as:
After exploring the marketing spend and sales results, here's what this data might look like:
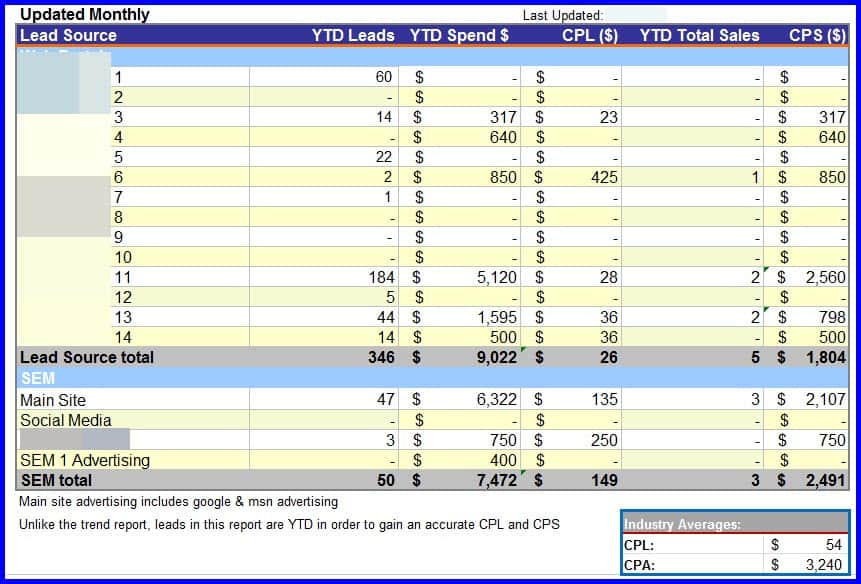
| This custom lead and sales tracking device is part of a multi-report that tracks sales pipeline status, territory development, industry performance benchmarks, online leads and sales, and more | |
| This custom lead and sales tracking device is part of a multi-report that tracks sales pipeline status, territory development, industry performance benchmarks, online leads and sales, and more |
Or, maybe you have sales people to account for. You can use your data to create an online leader board like the one we did for a leading nationwide services organization:
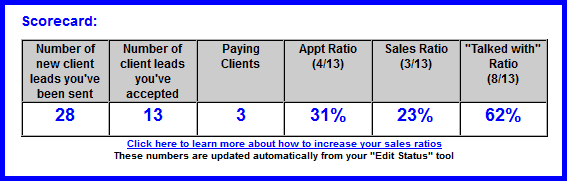
| We built this online scorecard (a real-time dashboard scorecard culled from many SQL databases) for 2,000+ salespersons to manage his/her statistics online. The organization used data like this to identify leaders to help underperformers learn from the best performers in the company. | |
| We built this online scorecard (a real-time dashboard scorecard culled from many SQL databases) for 2,000+ salespersons to manage his/her statistics online. The organization used data like this to identify leaders to help underperformers learn from the best performers in the company. |
Transform your data into a Strategic Action Plan in Step #4...