
How to increase website conversion rates (examples and guide)
You have a website — and it’s generating leads and making sales. You’ve run online ads, PPC, banner ads, maybe […]
Read More »Become a successful marketing consultant: Learn more
If you have ever wondered how food manufacturers compare, you have come to the right place!
While it may seem confusing, there is a big difference between the financial ratios of food manufacturers.
Food manufacturing financial ratios are benchmarking and market research tools. Reviewing food manufacturing financial ratios is important because it will help you see what the competition is doing, determine how well they are managing their assets, and reveal how well you are doing in the industry and against your competitors.
In this tutorial we are going to review the financial ratios of five of the top food manufacturing companies in the world.
And remember, big companies like these can implement the fanciest financial engineering strategies available, but long term success in the food business still comes back to these food marketing basics:
Not much else matters.
Let’s get started!
There are five basic food manufacturing financial ratios we often review to get a high-level picture of how well a food company is performing.
In addition to these numbers, we also assess their marketing, advertising, their customer value proposition and their use of their unique selling proposition(s). But for this brief tutorial, we are going to stay focused on the food manufacturing financial ratios.
The five food manufacturing financial ratios are; 1) Current ratio, 2) Debt ratio, 3) Gross profit margin, 4) Net profit margin, and 5) Return on total assets (ROA).
Let’s go through some examples by reviewing these world class food manufacturers:
We will also briefly describe what each financial ratio means so you can do this yourself.
The five food manufacturing financial ratios are:

These financial ratios help tell the story of how well each company is managing their assets. And since these companies are the best food manufacturers in the world, we will use them to measure all others against, whether a small food supplier who is just getting started, or a well-established food manufacturer with a vast distribution network.
The number of zeros doesn't really matter. The ratios matter.
These ratios are meant for:
And above all, drive massive marketing success!
Let’s now quickly review each of these metrics so it’s very clear what each is and why they are important.
We start with the current ratio, because when working with food manufacturers, one of the leading questions we receive is, “How much cash should we keep on hand?” This is another way of saying, “What is a good current ratio for the food manufacturing business?”
A good current ratio for the food manufacturing industry is where you have enough cash to meet your short term liabilities. A current ratio of 1.0 is a good place to start. As a general rule of thumb, if you move inventory quickly, your current ratio can be lower. Alternatively, if your inventory sits longer or you face more relative unknowns in the future, your current ratio needs to be higher. The examples below will better help you define your current ratio.
Well, here is how you answer this question.
When a company is over a value of “1.0” they have a good handle on their ability to pay their short term obligations.
The formula for the current ratio is:
Current assets / Current liabilities
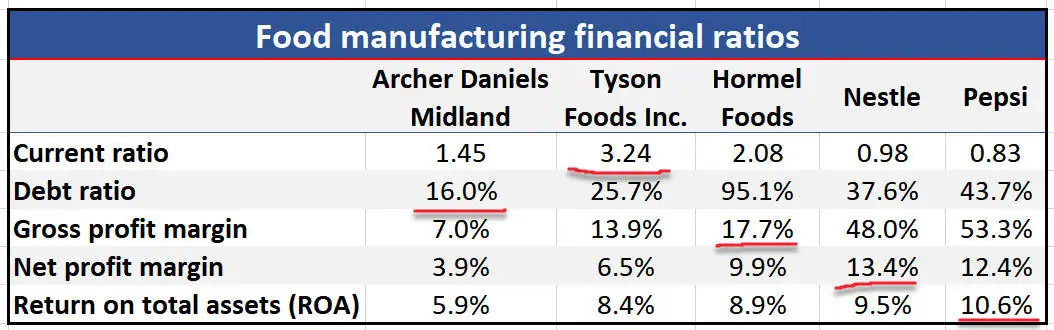
Archer Daniels Midland Current Ratio 2021 (in millions):
$31,909 current assets / $21,948 current liabilities = 1.45
This is one of the most important measurements of how well the company is prepared to pay their short term (less than 12 months) obligations.
Generally, the more a company focuses on inventory turnover, the lower the current ratio number may be. Regardless, a higher number is usually better, but if it’s too high, those assets can be better deployed to earn a high ROA.
Notice how the current ratio of Nestle and Pepsi compare.
Nestle has a current ratio of 0.98 and Pepsi has a current ratio of 0.83. The current ratios of Nestle and Pepsi, both with massive product lines, have a current ratio of less than 1.
On the contrary, Hormel and Tyson both have current ratios over 2.0.
Kudos to Archer Daniels Midland for being so responsible with their cash to ensure short term payments are made.
A debt ratio measures the amount of leverage used by a company in terms of total debt (both current debt and long term debt) to total assets. A debt ratio of greater than 100% means a company has more debt than assets while a debt ratio of less than 100% indicates that a company has more assets than debt.
Note, we have seen the debt ratio calculated multiple ways, ultimately the best way is to calculate this based on your industry.
For capital intensive industries, when interest rates go up they need to do some serious negotiating with their lenders. While companies like these have some serious purchasing power, the federal funds rate will probably increase at some point affecting all their ratios.
The formula for the debt ratio is:
Total debt (both short term debt and long term debt) / total assets
Tyson Foods Debt Ratio 2021 (in millions):
($1,067 short term debt + $8,281 long term debt) / $36,309 total assets = 25.7%
Note: Notice Hormel Foods’ debt ratio at 95.1%, which is very high compared to Tyson Foods at 25.7%. Their financial report reports “Current Maturities of Long-term Debt” under current liabilities. This is worthy of more research.
The gross profit margin is a very important measure of how much money is left over after a sales transaction in order to pay for fixed expenses.
The formula for the gross profit margin is:
Sales – cost of goods sold (a.k.a “gross profit”) / total sales
Hormel’s gross profit margin in 2021 (in millions):
$2,016 gross profit / $11,386 total sales = 17.7%
Gross profit margin varies among industries. Service based models typically have higher margins compared to an inventory model. Also, it is interesting to compare the gross profit margins of Archer Daniels Midland vs Tyson Foods and Hormel Foods against the far higher gross profit margin of Nestle and Pepsi.
This important metric measures how much money is collected per dollar of sales revenue received.
The formula for the net profit margin is:
Net income / net sales
Nestle’s net profit margin 2021 (in millions):
$11,757 (EBIT) / $87,470 total sales = 13.4%
Net profit margin helps the business determine if the company is creating enough profit from sales operations and if it needs to be a better manager of the operating costs.
This important ratio tells the business how well they are managing the company assets. Going back to the current ratio, as an example, if they hold too much cash idly, this ROA will suffer.
The formula for the return on total assets is:
Net income / total assets
Pepsi’s return on total assets 2021 (in millions):
$9,821 net income (EBIT) / $92,377 total assets = 14.2%
These are the five common financial ratios for the food manufacturing industry. There are many more ratios that could be part of your review process, but these will give you a great start to your financial review process.
And as always, if you need anything, Your Strategic Marketing Partner is happy to help!