The best marketing strategy in a competitive environment (Game-changer)
There has never been more competition for your customer’s time, attention and resources than today. Said another way… Right now, […]
Read More »Become a successful marketing consultant: Learn more

In addition to an annual SWOT analysis, forecasting is one of the most important planning activities for most manufacturers.
After all, forecasting affects how you price your products and services and how you make sales. Similar to creating an optimization model, where it's a “nice and neat little world” where you assume you know everything and create a model to determine what you should do next, forecasting is far more realistic and much more complex.
Forecasting is very valuable and very hard to do.
What is forecasting in manufacturing?
Forecasting in manufacturing is one of the most important manufacturer’s planning activities. The purpose of forecasting is to make better business decisions as it relates to topics such as, inventory management, production planning, purchasing, workforce scheduling, resource allocations and capital budgeting.
Fortunately, manufacturing forecasting experts and researchers have developed many quantitative forecasting best practices and procedures. Many of those are listed below.
These procedures range in their complexity levels, required expertise, and ease of use. Demand forecasting is elemental, especially with the rapid growth in the manufacturing industry.
However, before understanding some of the best forecasting practices in the manufacturing industry, a clear definition of forecasting is important.
Read below to understand forecasting in manufacturing, including some manufacturing forecasting best practices and how to forecast in manufacturing.
Forecasting is the estimation of a future occurrence. It is the art and science of knowing what you need before needing it.
Forecasting in manufacturing is estimating a variable in the future. The primary goal is to anticipate events of the future.
A manufacturing forecast serves as an input to multiple business decisions, including inventory management, production planning, purchasing, workforce scheduling, resource allocations, capital budgeting, etc.
-- Nada R. Sanders, Department of Management Science & Information Systems at Wright State University in Dayton, Ohio
For manufacturer’s, the forecast is a document that plans and manages inventory.
Manufacturers use the forecast to order products or raw materials from the supplier(s) to be ultimately delivered to the customer.
For example, the manufacturer's customer service representative may review a client's historical sales data and project future sales in order to figure how much product is required to be in stock, how much product should be in the warehouse, and the quantity of a product that should be in production.
Forecasting in manufacturing isn't simply a prediction but a channel to influence the future of the business. After all, forecasting in manufacturing affects:
And of course this affects scheduling, sales planning, support staff, utilities, warehousing, on and on.
It also affects the sales and marketing department who needs to know when to ramp up customer communications, product promotions, event planning, and the overall Marketing Mix.
But it is possible to construct a plan with the least possible variability.
Manufacturing business managers usually forecast inventory and supply quantities to meet demand at all times, despite forecasting stock levels usually being a bit of a problem even for veteran managers.
Forecasting then assumes that previous trends in the business will proceed with minimal variance in the future. This presents problem #1.
Another problem is that manufacturing trends tend to vary seasonally. However, shifting manufacturing trends must also remain consistent for forecasting to be effective. Manufacturers can strategize and implement forecasting best practices to make the best possible decisions.
Here's one forecasting model to help identify how much inventory to purchase, a very important forecasting method for manufacturers.
This is a real forecasting model built for a hard wood flooring manufacturer who wanted better systems for forecasting their inventory management. This forecasting model helped them make better decisions on how much inventory to purchase each time they ordered from their supplier.
The optimal amount of inventory to purchase is called the ‘economic order quantity’ (EOQ).
The purpose of this forecasting model is to create the optimal amount of inventory that the company should order at one time, which is why it is called the Economic Order Quantity (EOQ).
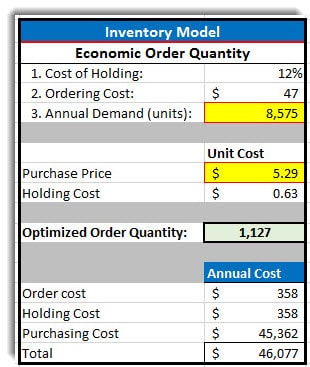
After updating the annual unit demand (top yellow cell) and the purchase price per unit (lower yellow cell), and tied the values to an algebraic formula, you can use Solver in Excel or Solver in Google Sheets to run thousands of calculations to find the optimal value. Here is an example of what this manufacturing forecasting model looks like.

This model told us that the most optimal quantity of units to order is 1,127 units.
This optimized number is based on:
With the EOQ, this construction manufacturer now knows what their optimal inventory purchase is – leading to a better purchase decision and better allocation of valuable resources.
Here's another real example of an EOQ model for a supplement manufacturing company.
Knowing how much inventory to purchase is a very common problem, especially in the supplement industry.
For one, if they tie up too much cash and hold too many units at one time, these resources could be getting a better return in other places. And, supplements usually have "use by date", which means inventory needs to be optimally purchased and sold. If the inventory isn't sold in time, then it goes to waste.
Second, if they do not purchase enough inventory and sell out before the next batch is completed, this bring many potential problems. Losing the customer is the most crucial, and as we know, no marketer on the planet wants to lose a good customer.
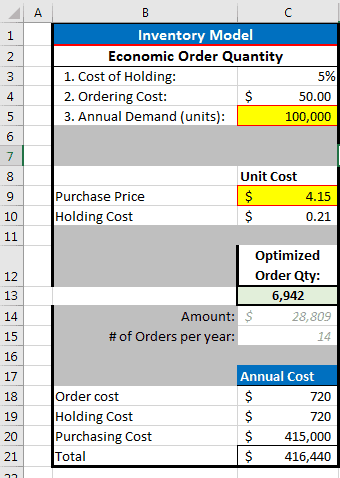
So, here's what we know:
After running Solver in excel with the goal to find the most optimal economic order quantity to place per order, this company found that the ideal quantity to order at one time is: 6,942 units.
This means the order value is $28,809 and the company should order 14 times per year.
Here's what this model looks like:

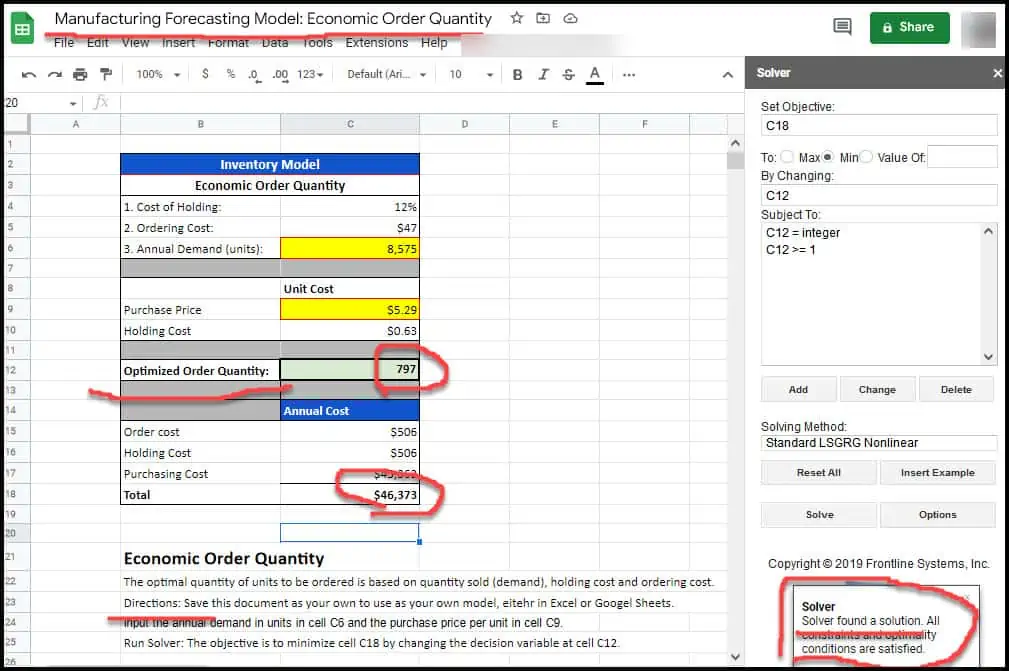
You can access this EOQ manufacturing forecasting model as a Google Sheets document here. Be sure to save it as your own:
Here is what this document looks like, with a screenshot of Solver in action (If you have never used Solver, it is worth going to Microsoft for a summary):

First, know that in forecasting you need data.
The purpose of this historical data is to give you confidence in forecasting future data.
Please read that again.
You don’t really care about what happened 10 months ago, let alone 2 years ago -- which, by the way, is a solid amount of historical data to always have on hand for forecasting purposes.
You only care about what you need to do in the next 30 days and beyond, or whatever time period you are forecasting.
The method you use to create this forecast is really dependent upon your past data.
For example, if for the past 2 years, you have sold 2,000 units per month of your widget, it is safe to forecast your next manufacturing run.
But if your CEO tells the sales and marketing team to 2x our promotions, this is where your forecasting skills need to shine. How much should you increase product production? This is also where your marketing team needs to scour conversion rate data in order to make some projections to the operations team.
In our tutorial on What are the benefits of sales forecasting? (+free forecasting model) we describe the two basic families of forecasting methods, 1) quantitative and 2) qualitative, and we provide some methods for each group. If you are forecasting a product or service with no sales, we provide you a free model that you can use.
As you build your preferred forecasting method, below are some best practices for accurate and reliable forecasting:
Experts say the average preparation time for an annual budget is 3-6 months!
While the average time for forecasting may take 1-4 weeks!
Either way, this is a long time to get important data that is the engine of a manufacturing company.
A “rolling view” of the organization (real-time) combined with strategic analysis is the literal cure. You’ll need to figure out how to develop and implement a method allowing you to compile and view the most important information on an automated basis. While it will take some time to develop, or to locate some forecasting software that may work for you, similar to your marketing Key Performance Indicators (KPI’s), you can adjust your forecasting model drivers to provide a constantly rolling forecast.
Is everyone at the company aligned on the numbers?
If you are like most companies, the answer is “no”.
A solid forecasting plan needs everyone to be on the same page and ensures that everyone can access the latest data.
Unfortunately, oftentimes data spews in from isolated spreadsheets and streaming in from different sources such as personal inventory, production, and expense reports, as well as Enterprise Resource Planning and even alternative operational systems. The result is decisions that are delayed, based on stale data or even lacking important components.
The best practice is to avoid unreliable spreadsheets and implement a specialized tool that incorporates the latest data from all sectors to drive your inventory models or standard costs. Developing a single source of reliable data in a manufacturing organization keeps people on the same page.
Modern businesses require agility. Finance teams require flexibility to effortlessly spin-off several what-if scenarios at any unscheduled time. This plan explores the implications of possible strategic decisions and helps decide effectively.
Such complex planning can be swift and easy with the proper platform. It can also be much more effective than conventional spreadsheet-based planning. The right platform should allow you to change assumptions easily and notice results quickly. You can analyze the implications as long as desirable.
But don’t be intimidated by this. You can keep it simple. Start with 3 sample “What if” scenarios: Plan A, Plan B and Plan C. Plan A is your “Best case scenario that you are planning for”, Plan B is your “This could happen scenario” and Plan C is your “This could happen but we would rather it not be this poor” scenario.
Demand planning and forecasting can be inaccurate and nuanced.
As a result, each forecast you produce can benefit from fine-tuning. Your manufacturing organization should regularly evaluate its forecasts for accountability and improvement, mostly during the sales and operations planning review process.
Collecting valuable insights from stakeholders during this process can enrich your baseline forecasts.
You can also track the forecast value-added metric to evaluate components of the forecast process. This way, you can identify what is of value and what you can eliminate.
Choosing the right forecasting technique in manufacturing isn't always easy. Forecasting in manufacturing combines past experience, general skill, and a relatively sufficient dose of financial judgment. Depending on your manufacturing operation's size, statistical tools and techniques are also valuable for creating more accurate forecasts.
Forecasting is a mix of past experience judgments with a mix of present and past data — inventory, sales, production, personnel, equipment, facilities, schedule, etc. — to make informed business decisions.
The bottom line is that the goal of forecasting is to predict the future using historical data points.
Do you want to forecast your manufacturing business? Speak to an expert on the matter regardless of the side of your operation and get professional advice or help.